Open AI-RAN Testbed
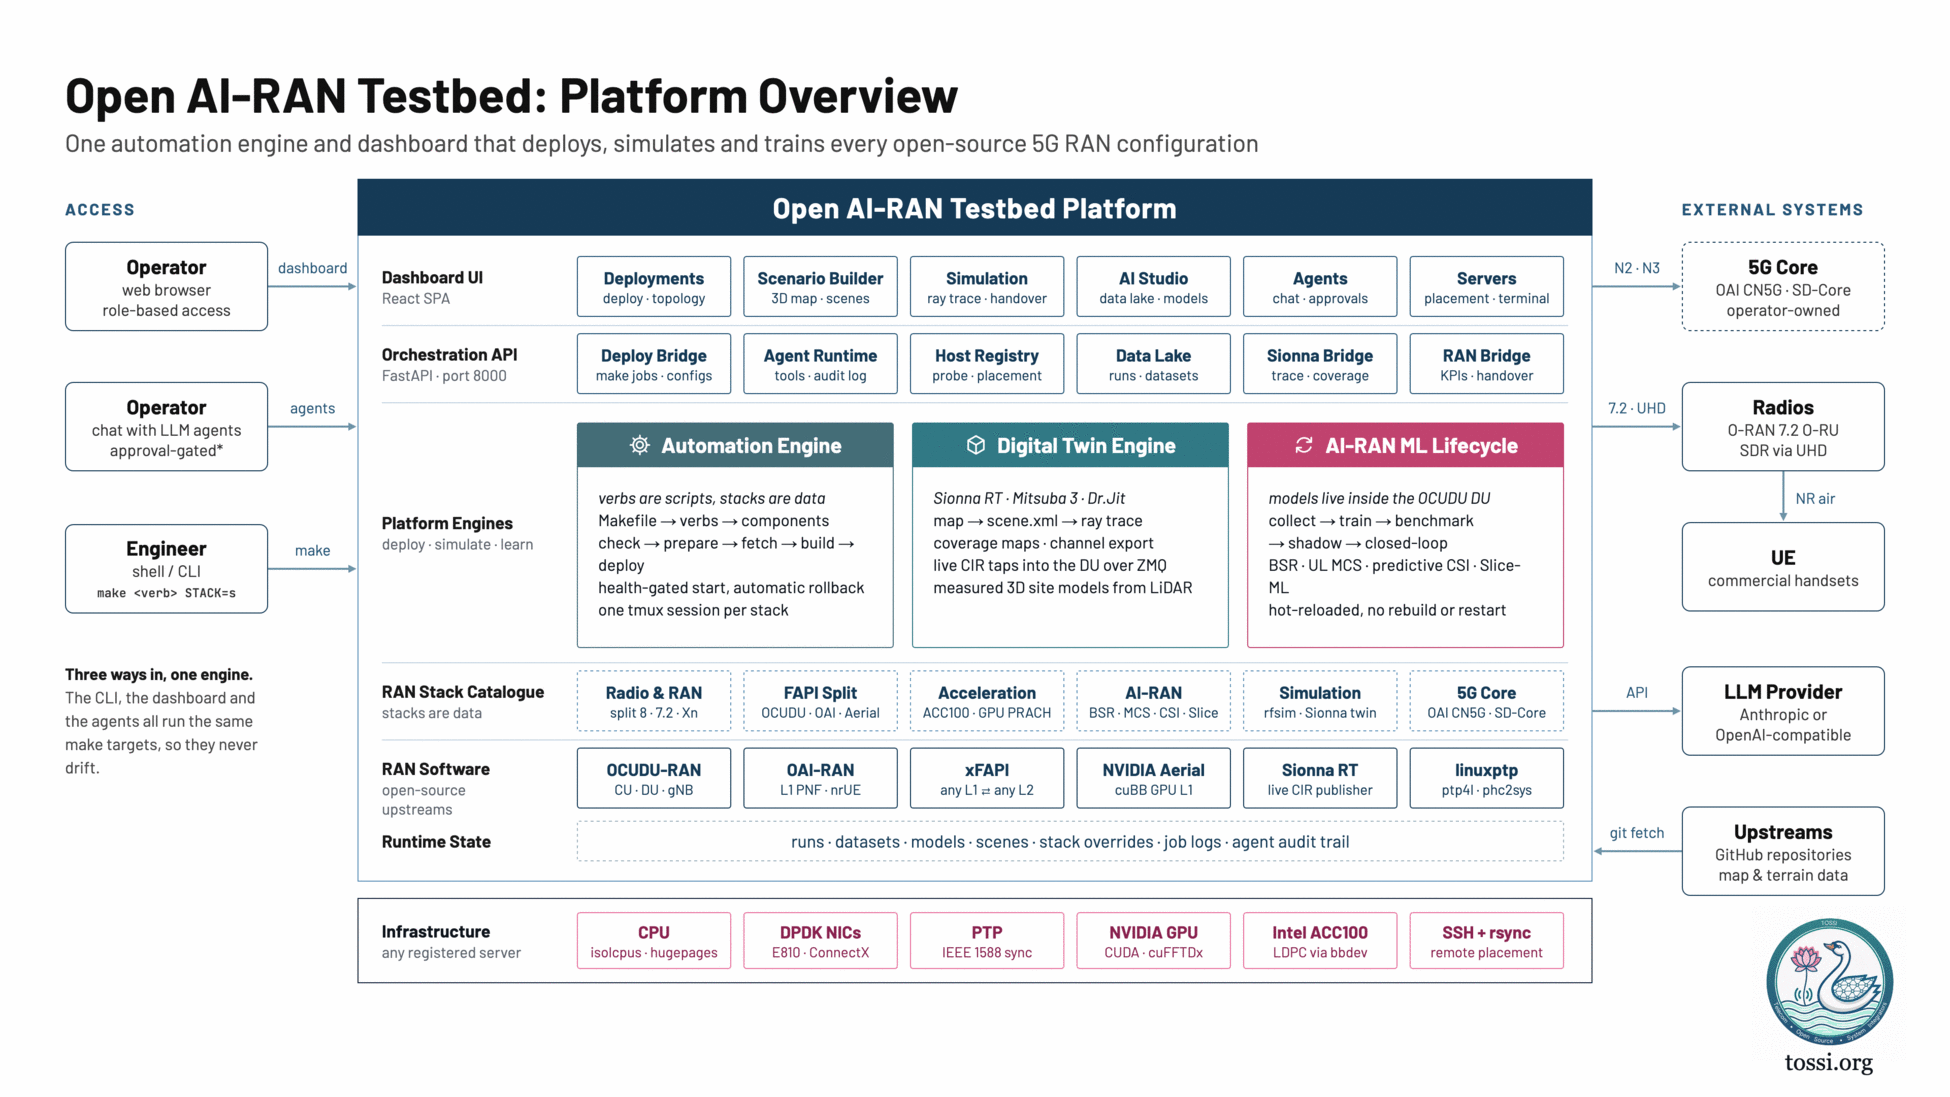
The Open AI-RAN Testbed is a platform for deploying, simulating and training open-source 5G RAN configurations. It provides one automation engine, one dashboard and one command-line interface over a catalogue of RAN stacks, from a software-simulated radio through to an over-the-air deployment with real radio units.
The same engine drives three entry points. An engineer runs make <verb> STACK=<name> from a shell, an operator uses the dashboard in a browser, and an LLM agent calls the same actions under an approval gate. All three execute identical targets and share one settings file per stack, so a configuration changed in one place is the configuration the others use.
Features
One engine, three interfaces
Verbs are scripts and stacks are data. A stack is a configuration file listing its components, their start order, the capabilities it requires and the variables its components read. Every component implements the same contract: deps, build, configure, start, stop and status.
Per-stack settings are written to one overrides file that both the dashboard and the command line read, so the two cannot disagree. Settings resolve in a fixed order: a value passed on the make command line, then the stack's overrides file, then the stack configuration, then the pinned versions file.
Stack catalogue
Stacks are grouped by family. Each is deployed, stopped and configured the same way.
| Family | Stacks |
|---|---|
| 5G Core | core-oai-cn5g, core-sd-core |
| Radio and RAN | ocudu-split72-liteon, ocudu-split8-usrp, ocudu-split8-zmq, ocudu-xnap-handover |
| FAPI split | aerial-l1-xfapi-ocudu-l2, oai-l1-xfapi-ocudu-l2, ocudu-l1-xfapi-ocudu-l2 |
| Hardware acceleration | ocudu-gpu-inline, ocudu-hwacc-acc100, ocudu-prach-gpu |
| Simulation | multi-ue-sim, rfsim-multi-ue, sionna-rt-ocudu |
| AI-RAN | ai-ran-bsr, ai-ran-csi, ai-ran-mcs, ai-ran-slice |
Server placement
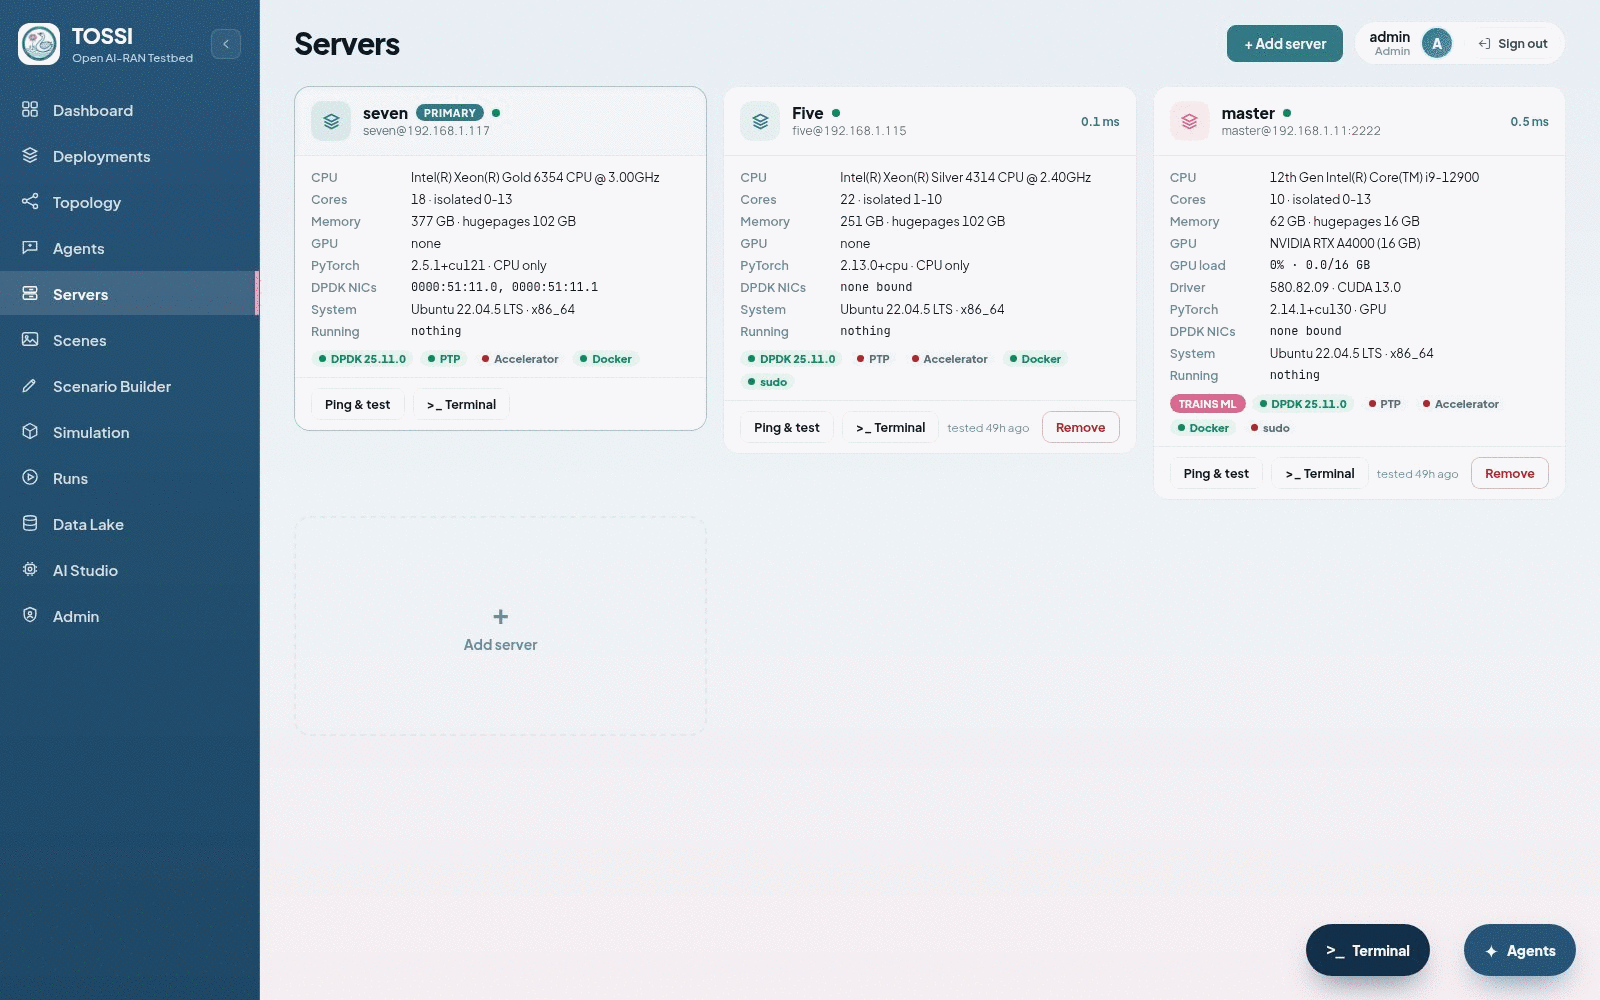
Any number of servers can be registered. One is the primary and orchestrates the rest over SSH. Each server is probed for its capabilities, which include isolated CPU cores, hugepages, a DPDK-capable NIC, PTP, a hardware accelerator and a GPU.
When a stack is selected, the registered servers are ranked against the capabilities it requires, and a server that cannot satisfy them is shown as unavailable with the unmet requirement given. A whole stack can be moved to one server, or individual components placed on different servers. Before each action the primary copies the automation tree and the stack settings to the remote server and runs the component there.
Digital twin
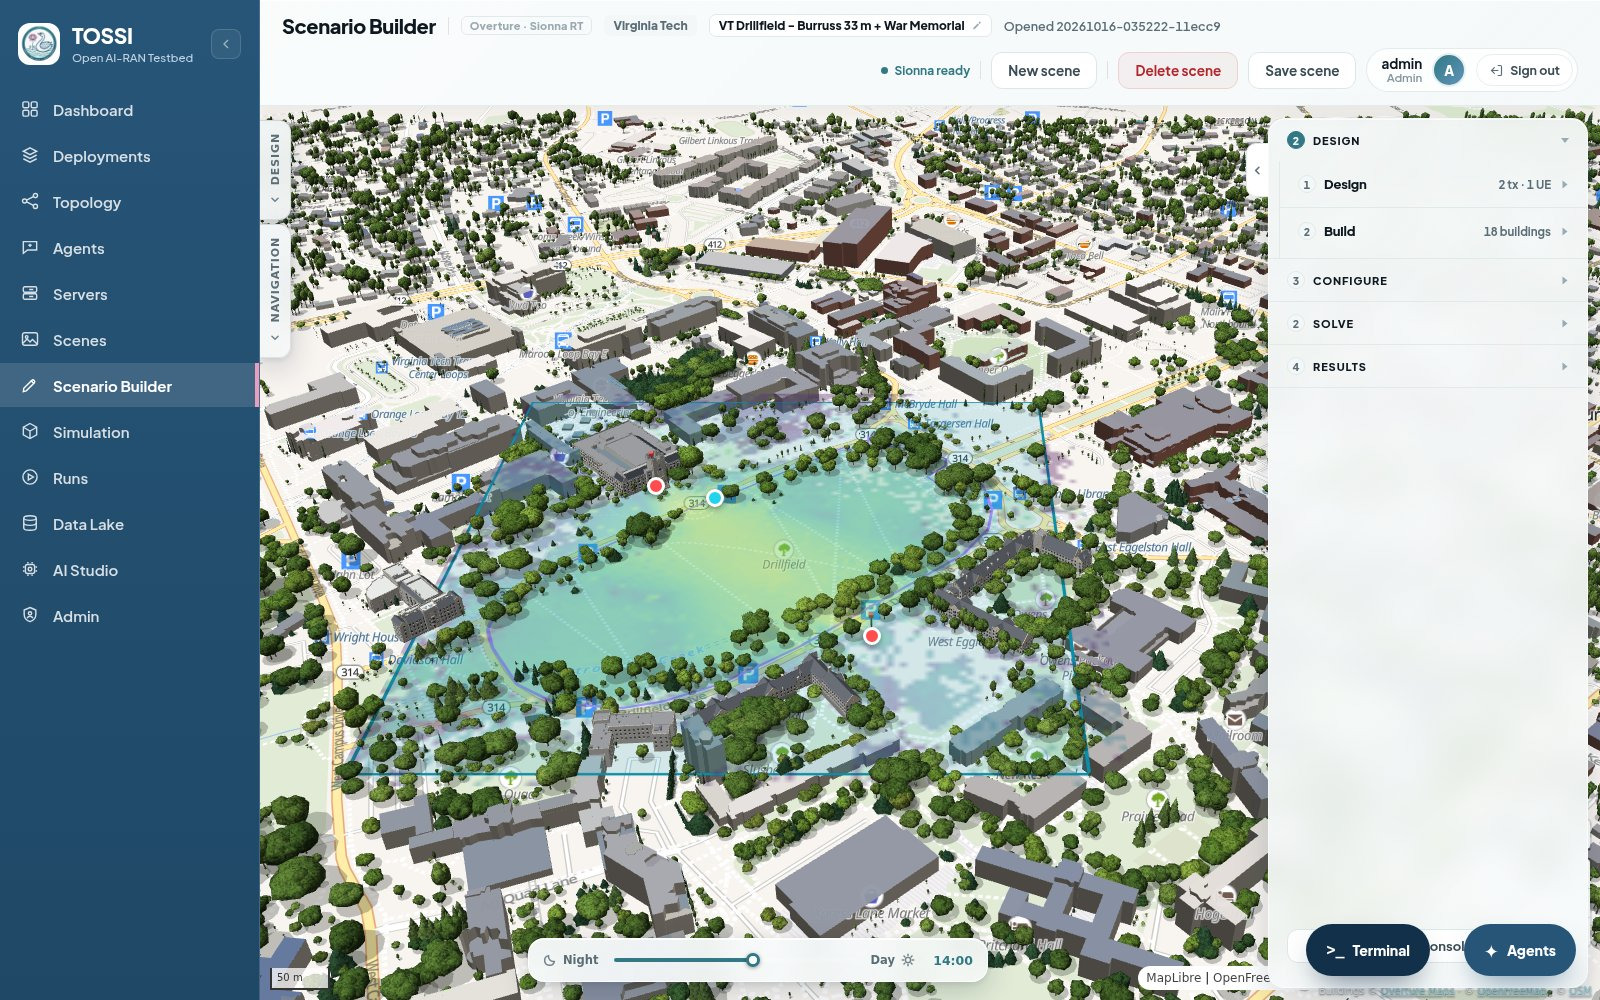
The Scenario Builder draws an area on a map, places transmitters, receivers and a route for a moving receiver, and builds a 3D scene. Building can use open map data with optional terrain and foliage, or a measured site model with surveyed footprints and LiDAR heights.
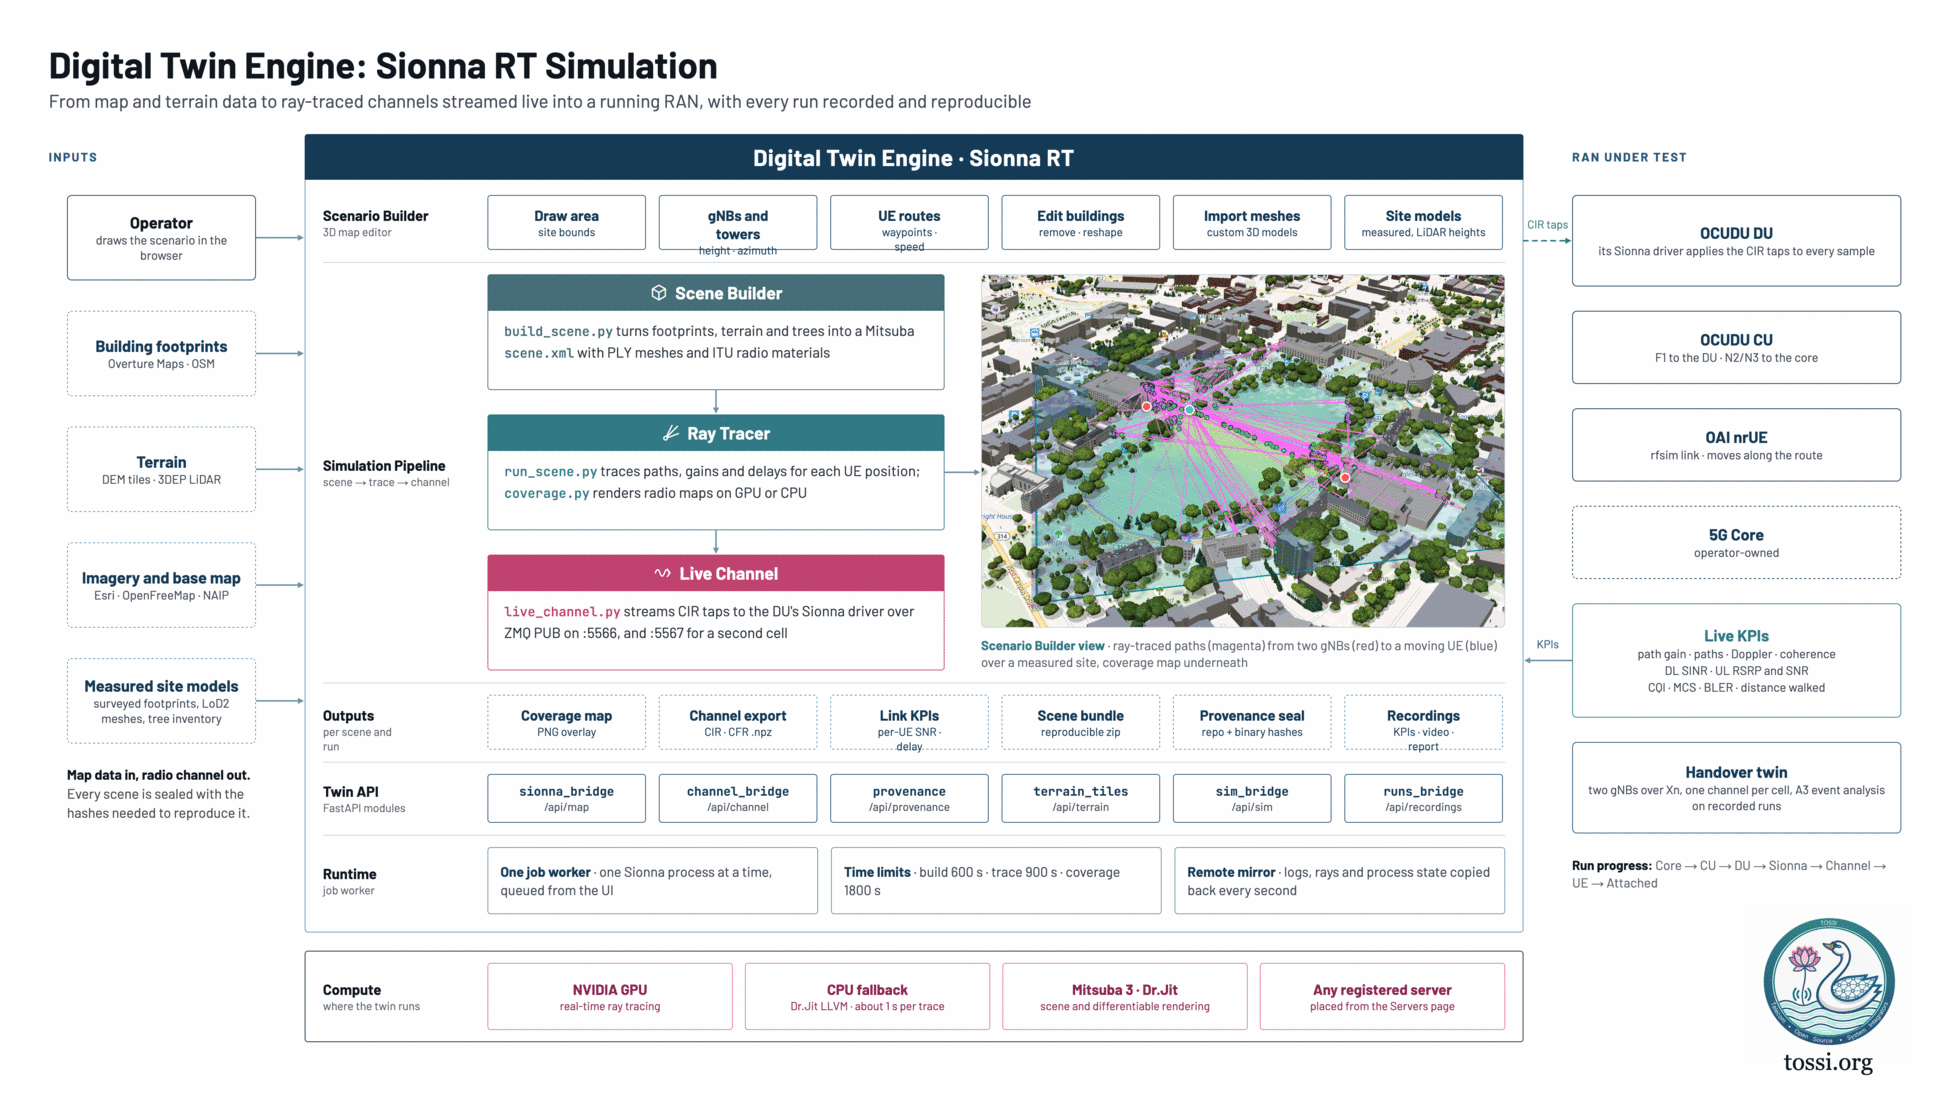
From a built scene the platform ray traces each cell, computes a coverage map, reports per-link KPIs and exports the channel. A scene can be packaged as a self-contained bundle that reproduces it from the Sionna runtime alone.
RAN over a simulated channel
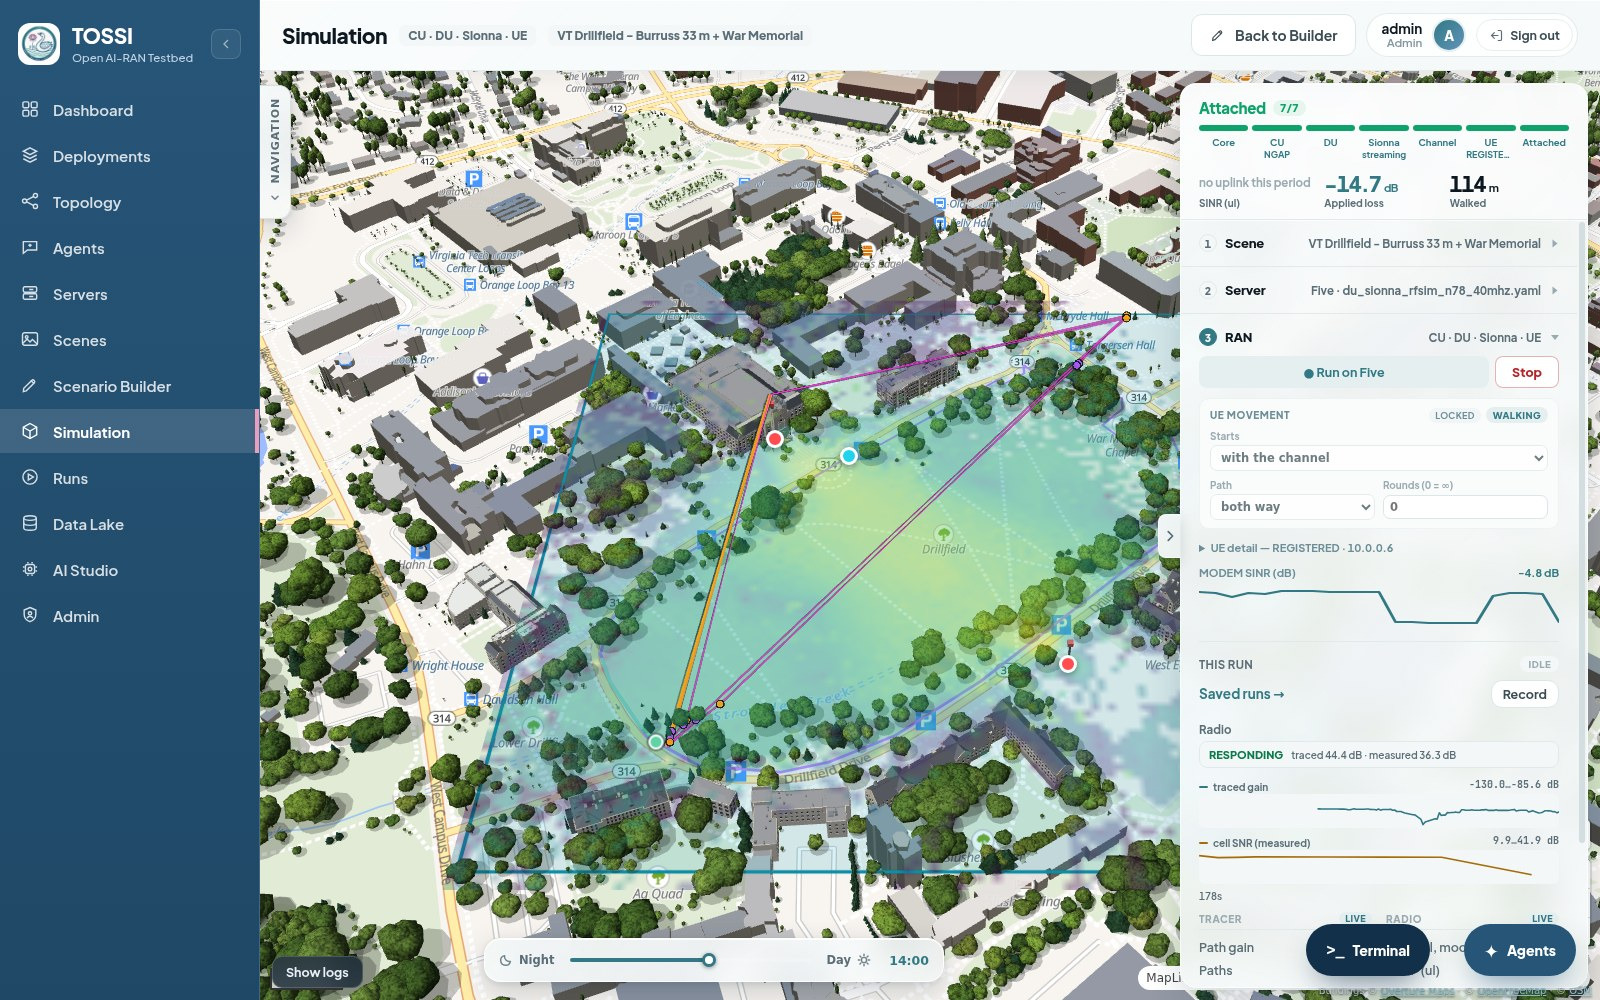
A real CU, DU and UE can be run with the radio channel between them computed live from a built scene. The DU's radio driver filters its transmit samples with the channel taps the ray tracer streams, so the protocol stack is unmodified and only the channel is synthetic. A GPU makes tracing real time; CPU tracing works through a software backend at lower rates.
A two-cell variant runs two gNBs connected over Xn, each with its own channel, and a receiver that walks between them, which exercises measurement-triggered handover. Recorded runs can be analysed against an A3 event model through the API to compare predicted and actual handovers.
AI-RAN model lifecycle
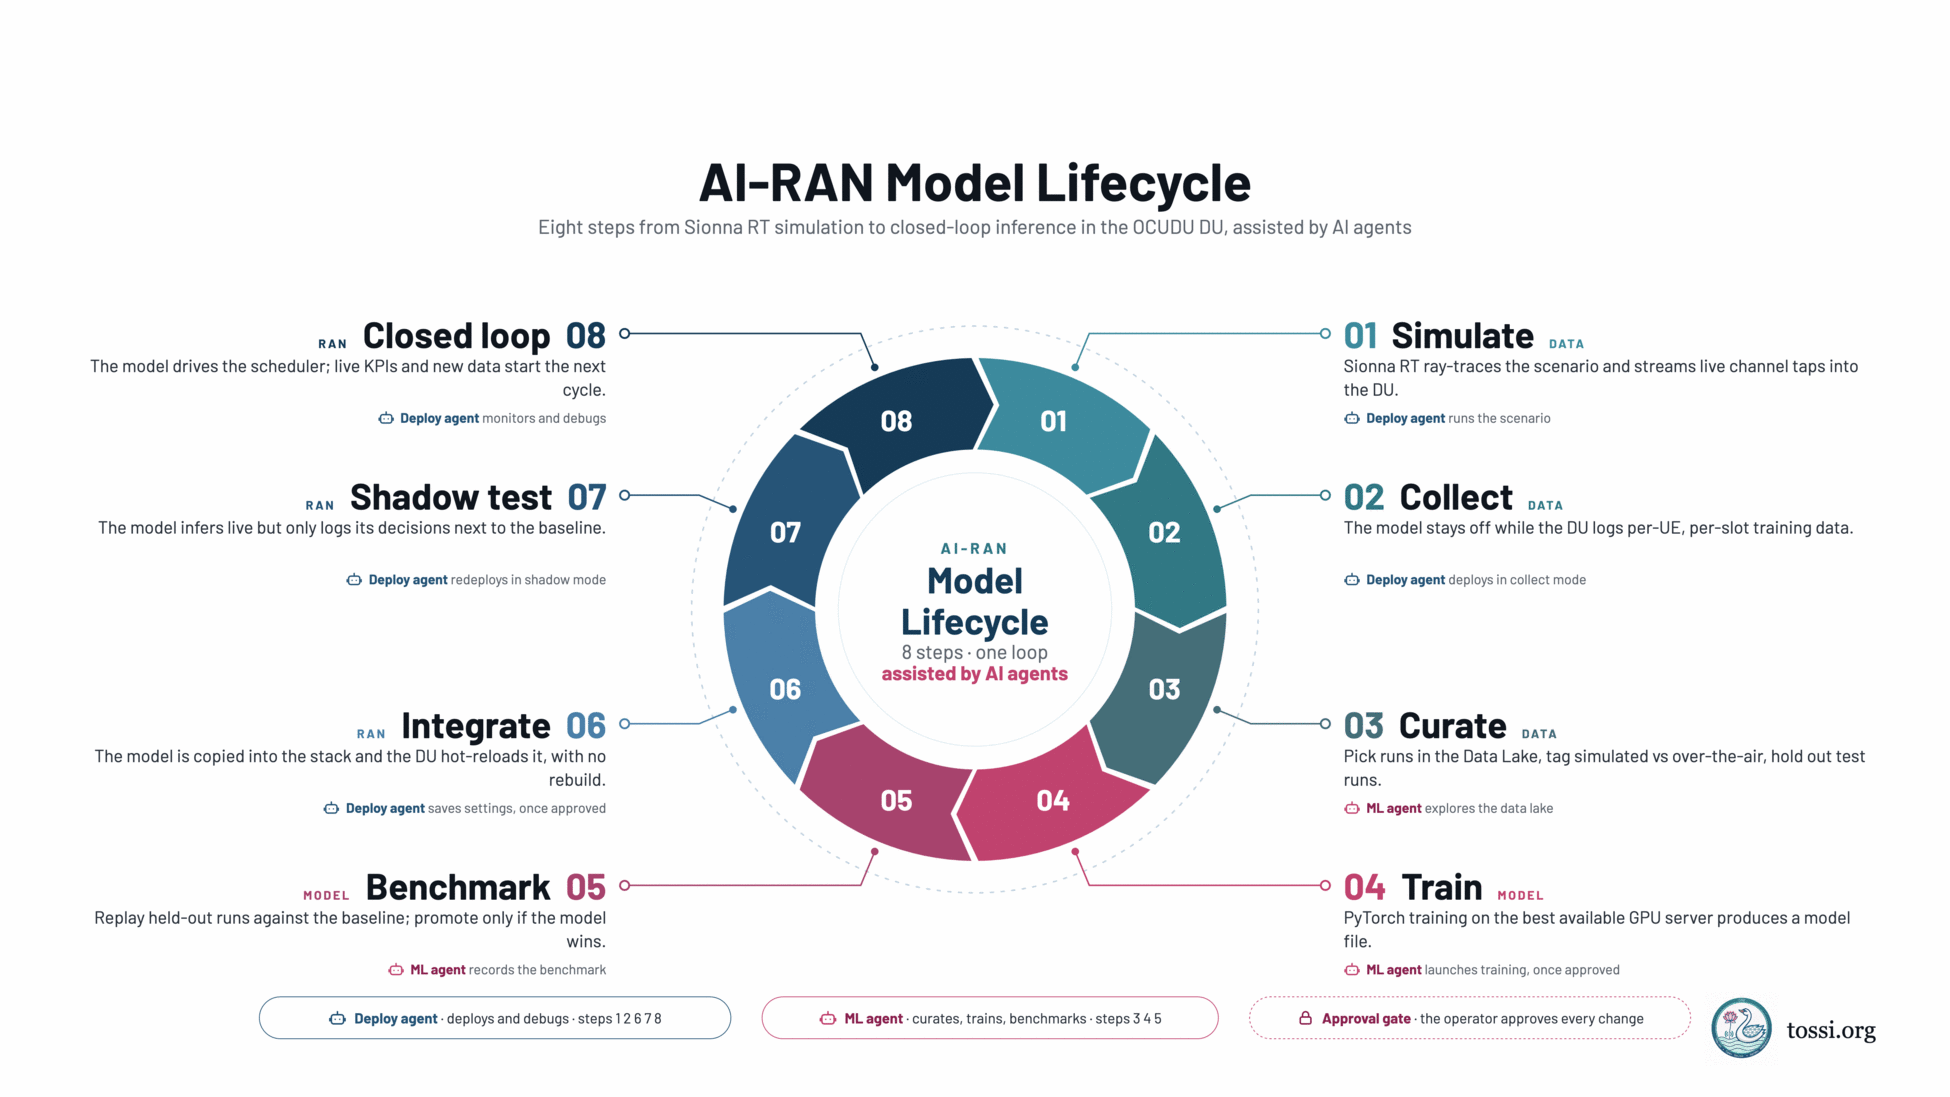
Each AI-RAN stack runs a DU with one machine-learning feature built in, and the model is a file the DU loads. A mode setting selects the stage:
| Mode | Behaviour |
|---|---|
collect | Logs a dataset. The model is not used. This is the default |
shadow | Runs the model and logs its decision beside the baseline, without acting on it |
closed-loop | Applies the model's decision |
Dataset logging stays on in every mode. The DU reloads the model file whenever it changes, so a retrained model requires no rebuild and no restart. The progression from collect to shadow to closed-loop is followed without skipping a stage, training uses data collected with inference off, and a model is promoted only when it beats the baseline on held-out runs.
Operator agents
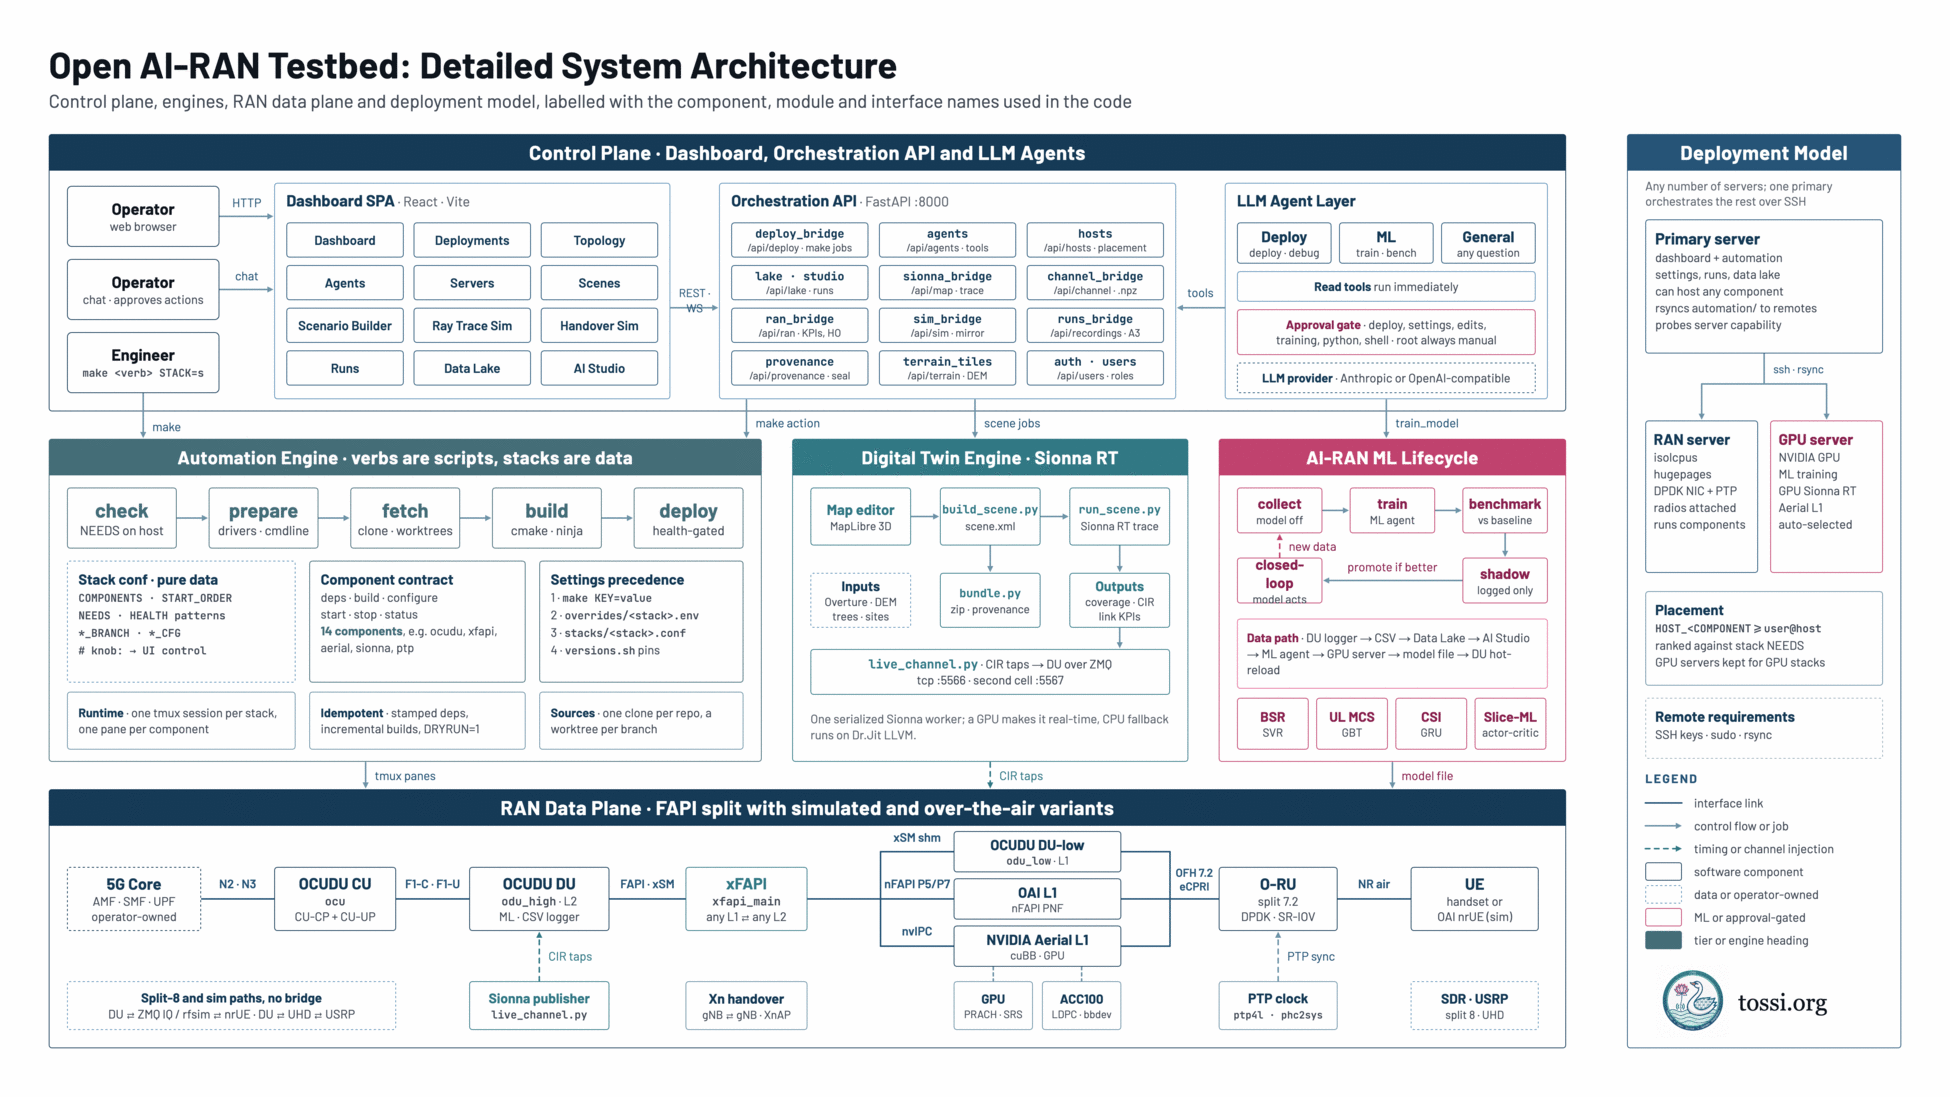
Three LLM agents are available, covering deployment, machine learning and general questions about the testbed. Each calls the same functions as the API.
Read-only tools run immediately. Any tool that changes state pauses for approval, and shell commands run with elevated privileges always require a manual approval. Every tool call is written to an audit log.
Architecture
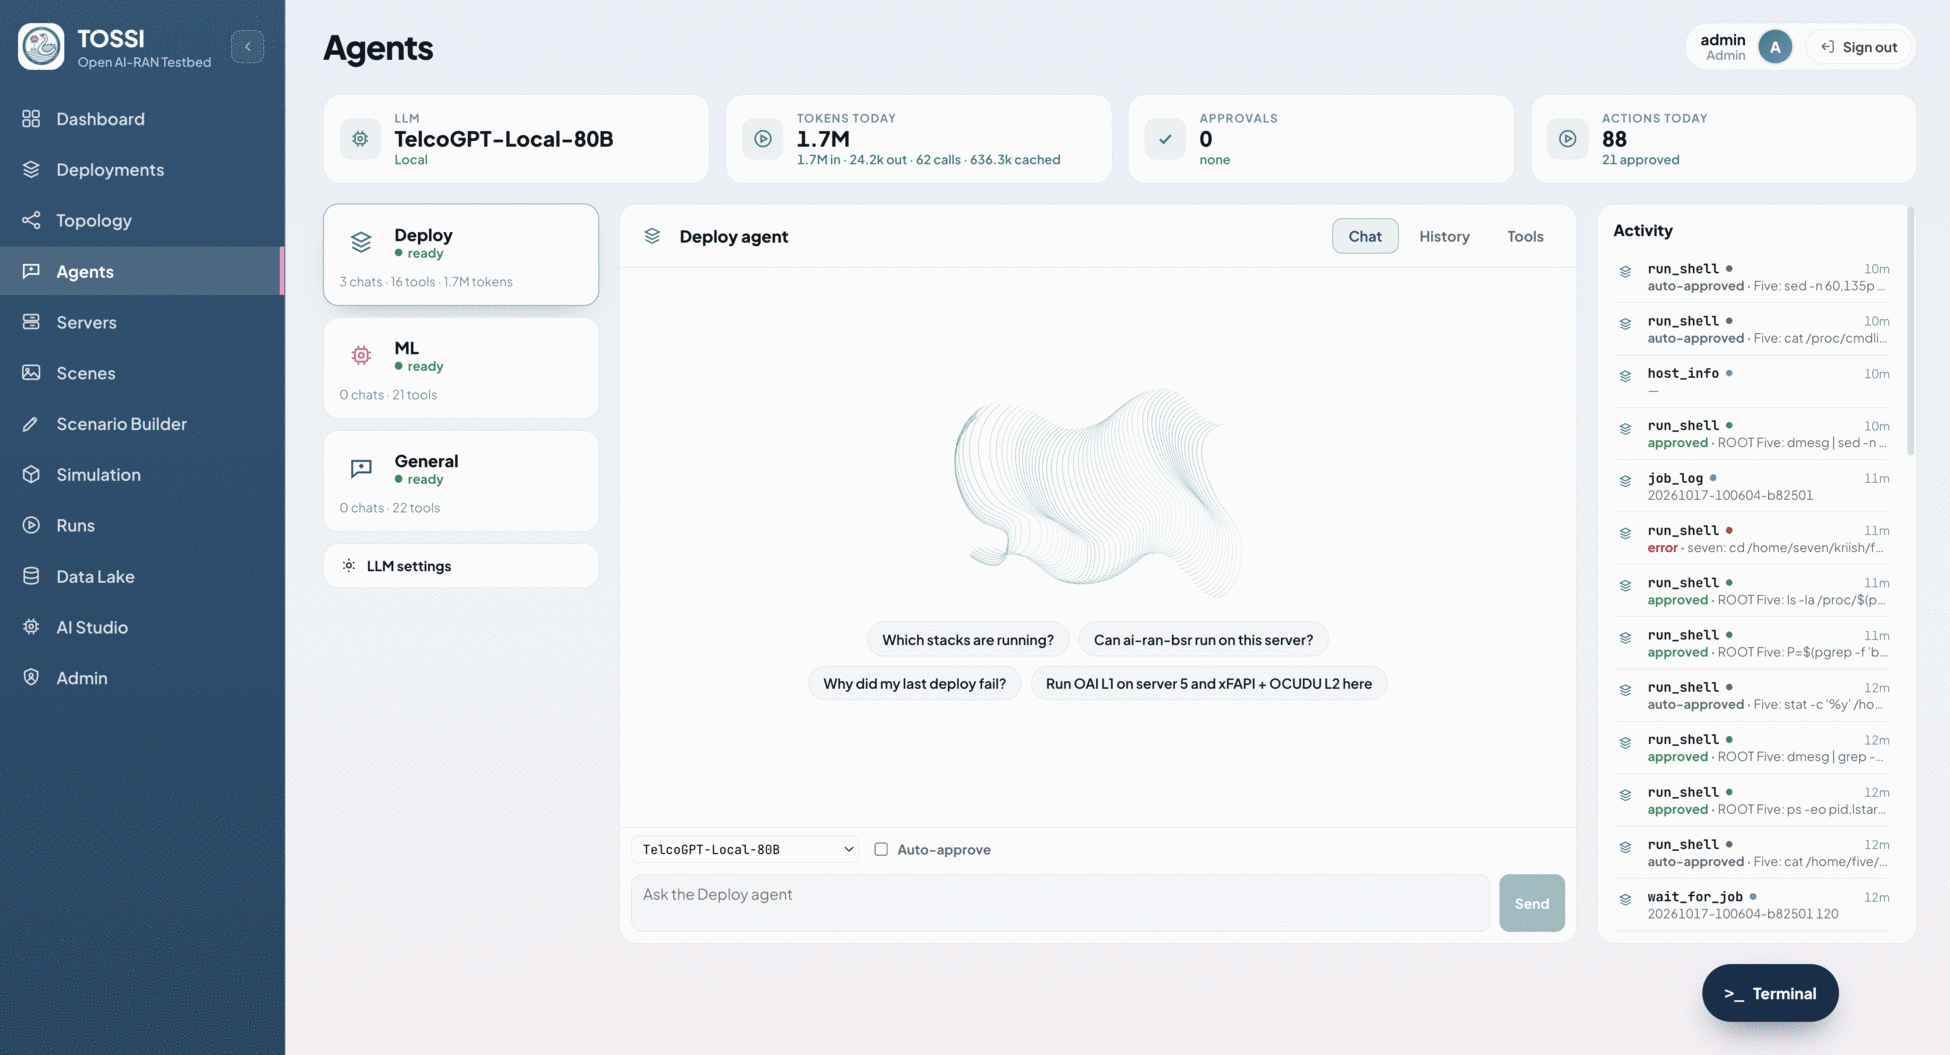
The platform divides into a control plane, three engines, the RAN data plane and a deployment model.
Deployment guide
Prerequisites
One Linux server is enough to begin. Additional servers can be registered later and are required only for the capabilities they provide.
- A Linux host with the build dependencies of the stacks to be deployed.
- Passwordless
sudo, since RAN components bind interfaces and set real-time priorities. - A Python interpreter with the Sionna runtime installed, for the digital twin features.
- For remote servers: key-based SSH from the primary, passwordless
sudo, andrsync. - Optional per stack: isolated CPU cores and hugepages, a DPDK-capable NIC, PTP, a hardware accelerator, or a GPU.
Get the source
The platform, its automation engine and the stack catalogue live in one repository:
git clone -b main https://github.com/TOSSI-Foundation/Open-AIRAN-Testbed.git
cd Open-AIRAN-Testbed
Starting the platform
Then, from the repository root:
make dashboard
On first run this creates the backend environment, installs the frontend packages, builds the interface and serves the whole application from a single port. The main settings are given as environment variables:
| Variable | Default | Effect |
|---|---|---|
PORT | 8000 | Listening port |
HOST | 0.0.0.0 | Bind address. A loopback address keeps the platform on one machine |
TOSSI_PASSWORD | generated | Workspace password |
TOSSI_SIONNA_PYTHON | per install | Python interpreter carrying the Sionna runtime |
Accounts and roles
Accounts are stored with hashed passwords. Three roles are available:
| Role | Permitted |
|---|---|
admin | Everything, including accounts, roles and password resets |
operator | Everything except managing accounts |
viewer | Reads every page. Action controls are hidden and the API refuses writes |
Registering servers
The server running the platform is the primary. Others are added once and can then run any component of any stack, or run model training.
Adding a server takes a nickname, a user, an address and a port, and either a password used once to install the primary's public key, or a key the operator installs themselves. A connection test and a capability probe run automatically, and the result is shown as a set of badges covering DPDK, PTP, accelerator, container runtime and privilege escalation. A server cannot be removed while it still runs part of a stack.
Usage guide
Navigating the interface
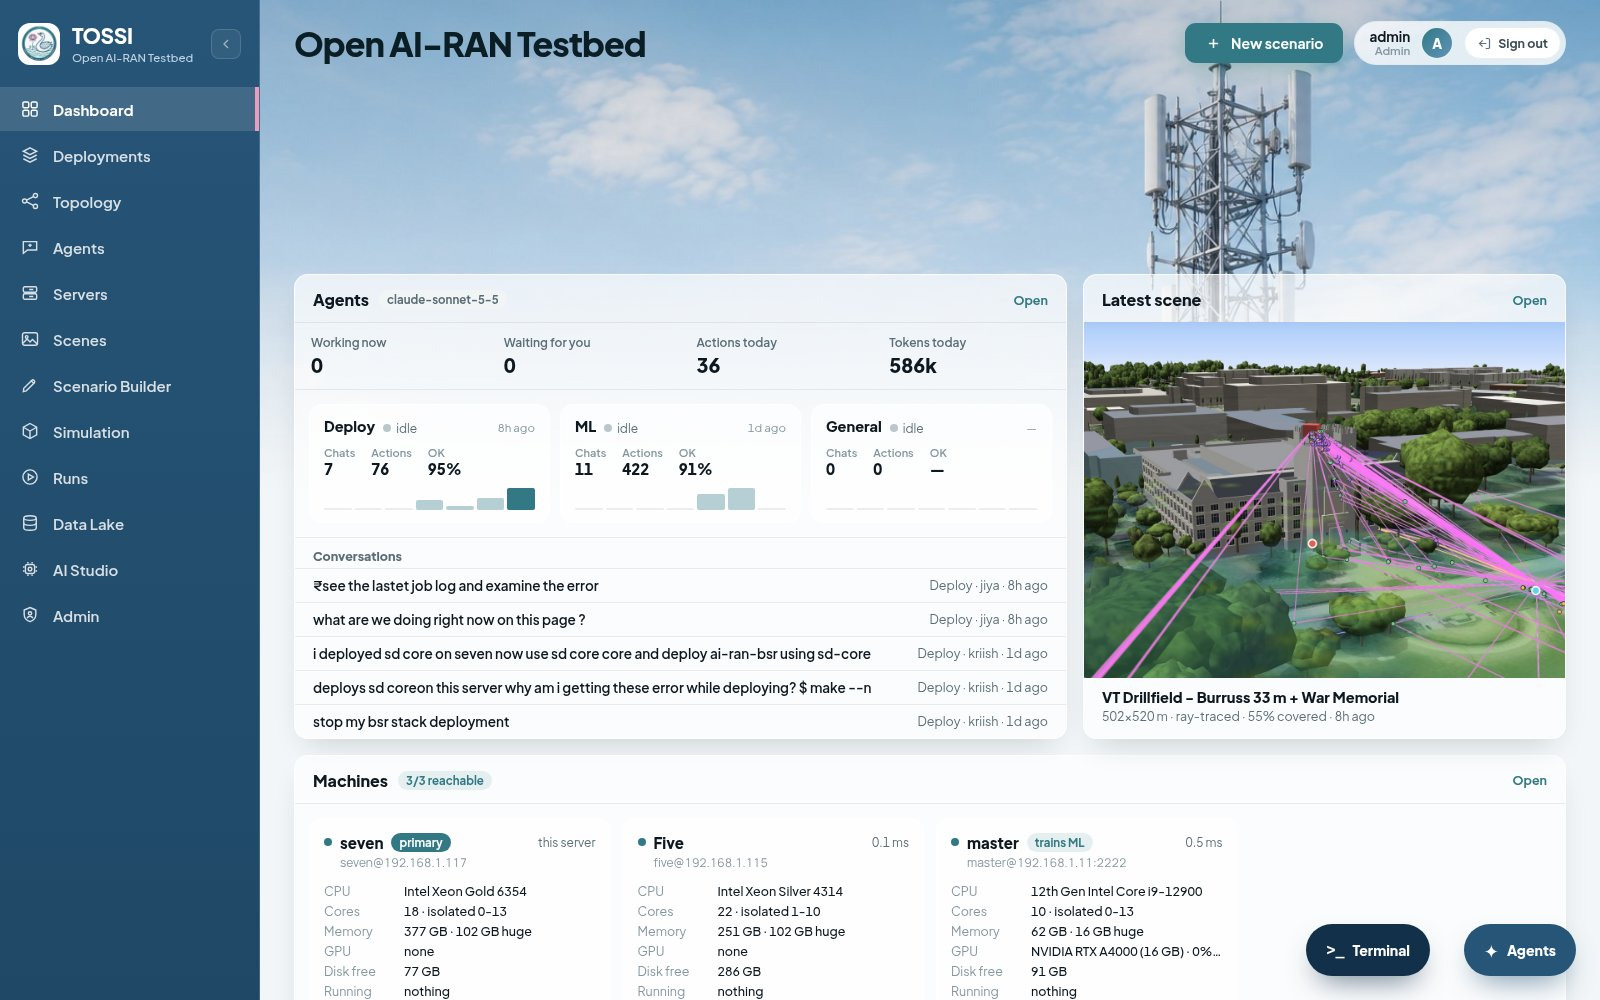
The sidebar groups the platform by task.
| Page | Purpose |
|---|---|
| Dashboard | Agent activity, the latest scene, machine health, models and data, and recent runs |
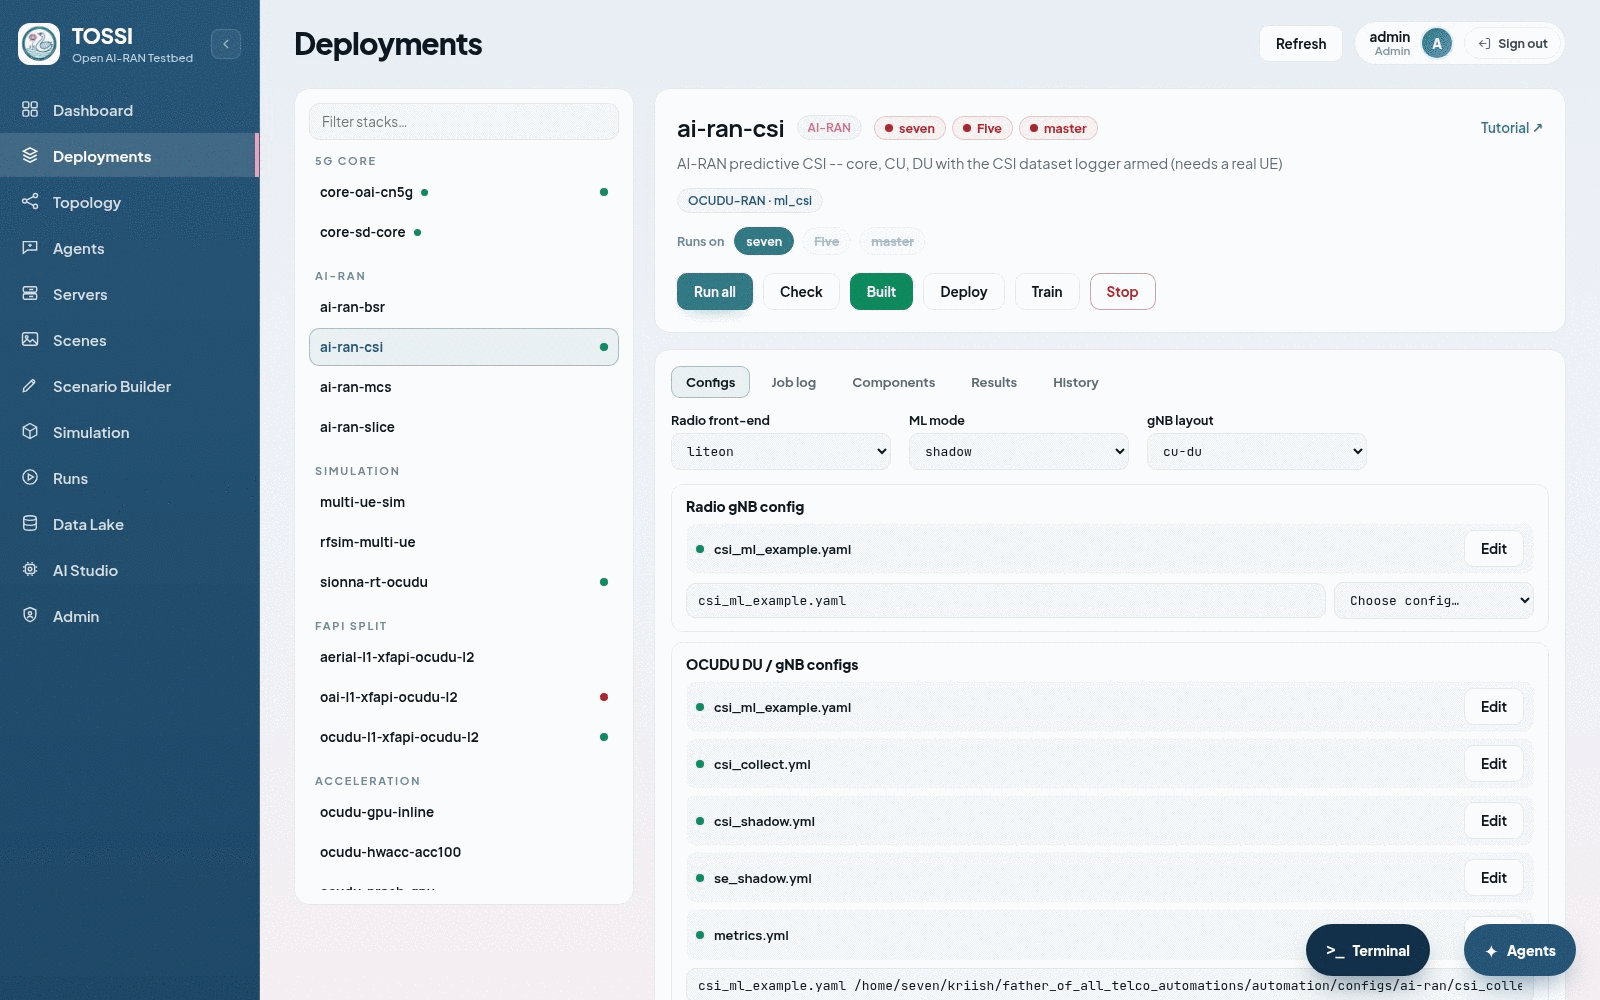
| Deployments | Check, build, deploy, stop and train stacks, edit configuration, read logs |
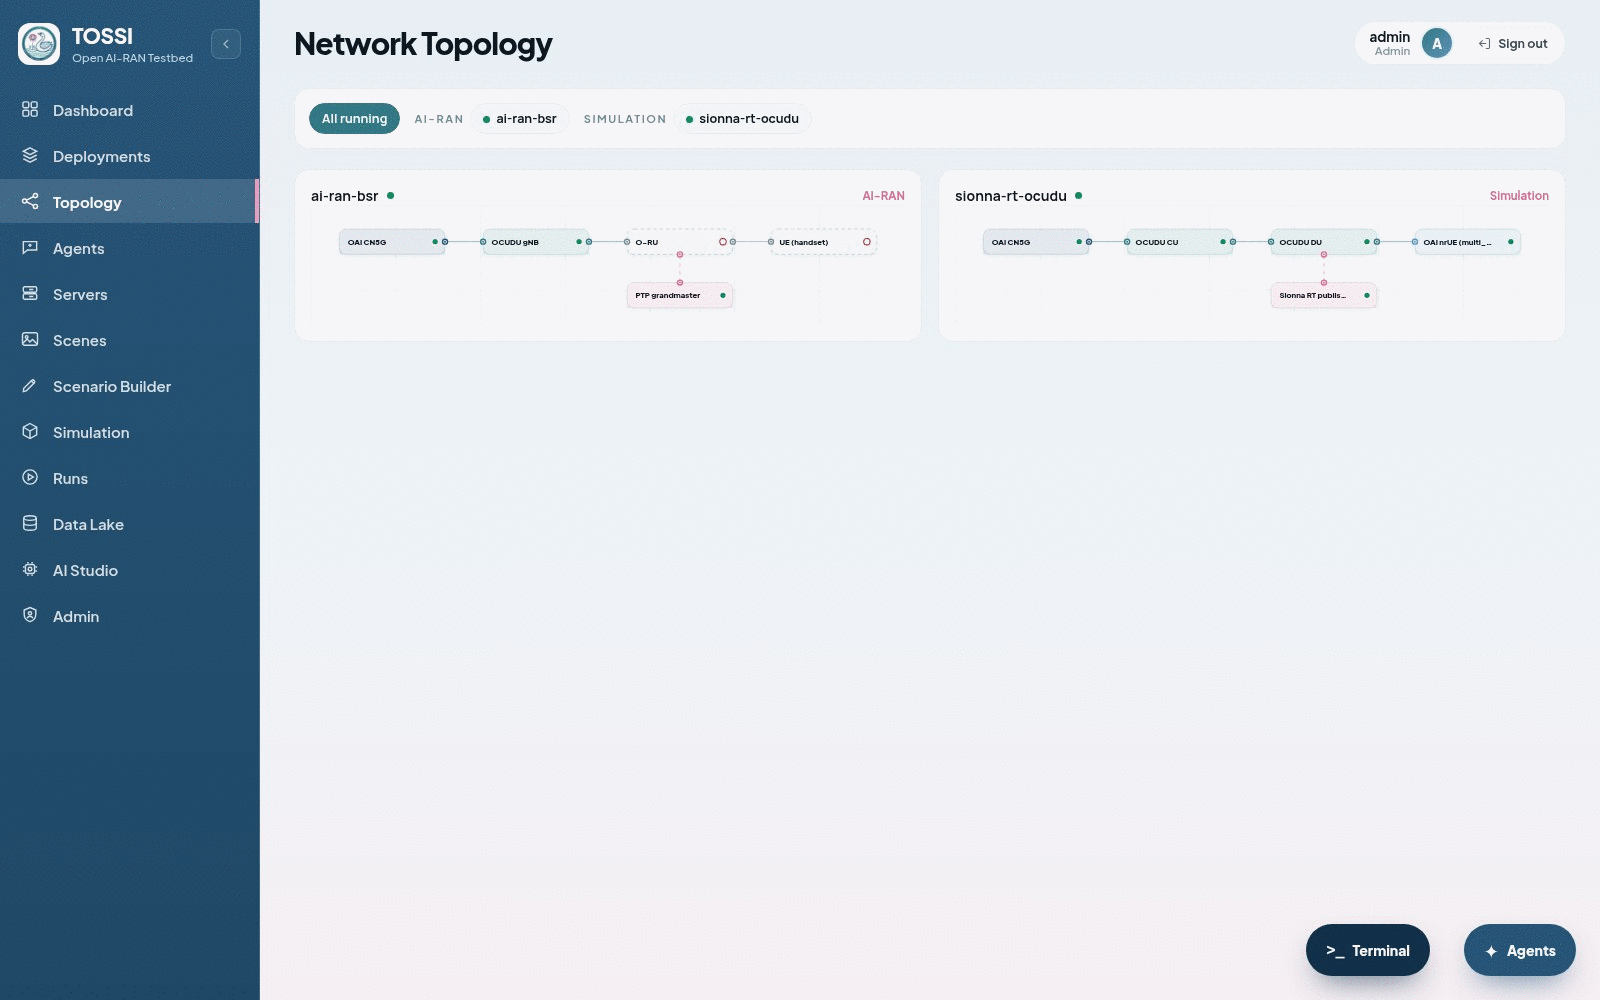
| Topology | Each running stack drawn as a network, with interface labels and live KPIs |
| Agents | Chat with the agents, approve their actions and configure the provider |
| Servers | Register servers, check their capabilities and open a terminal |
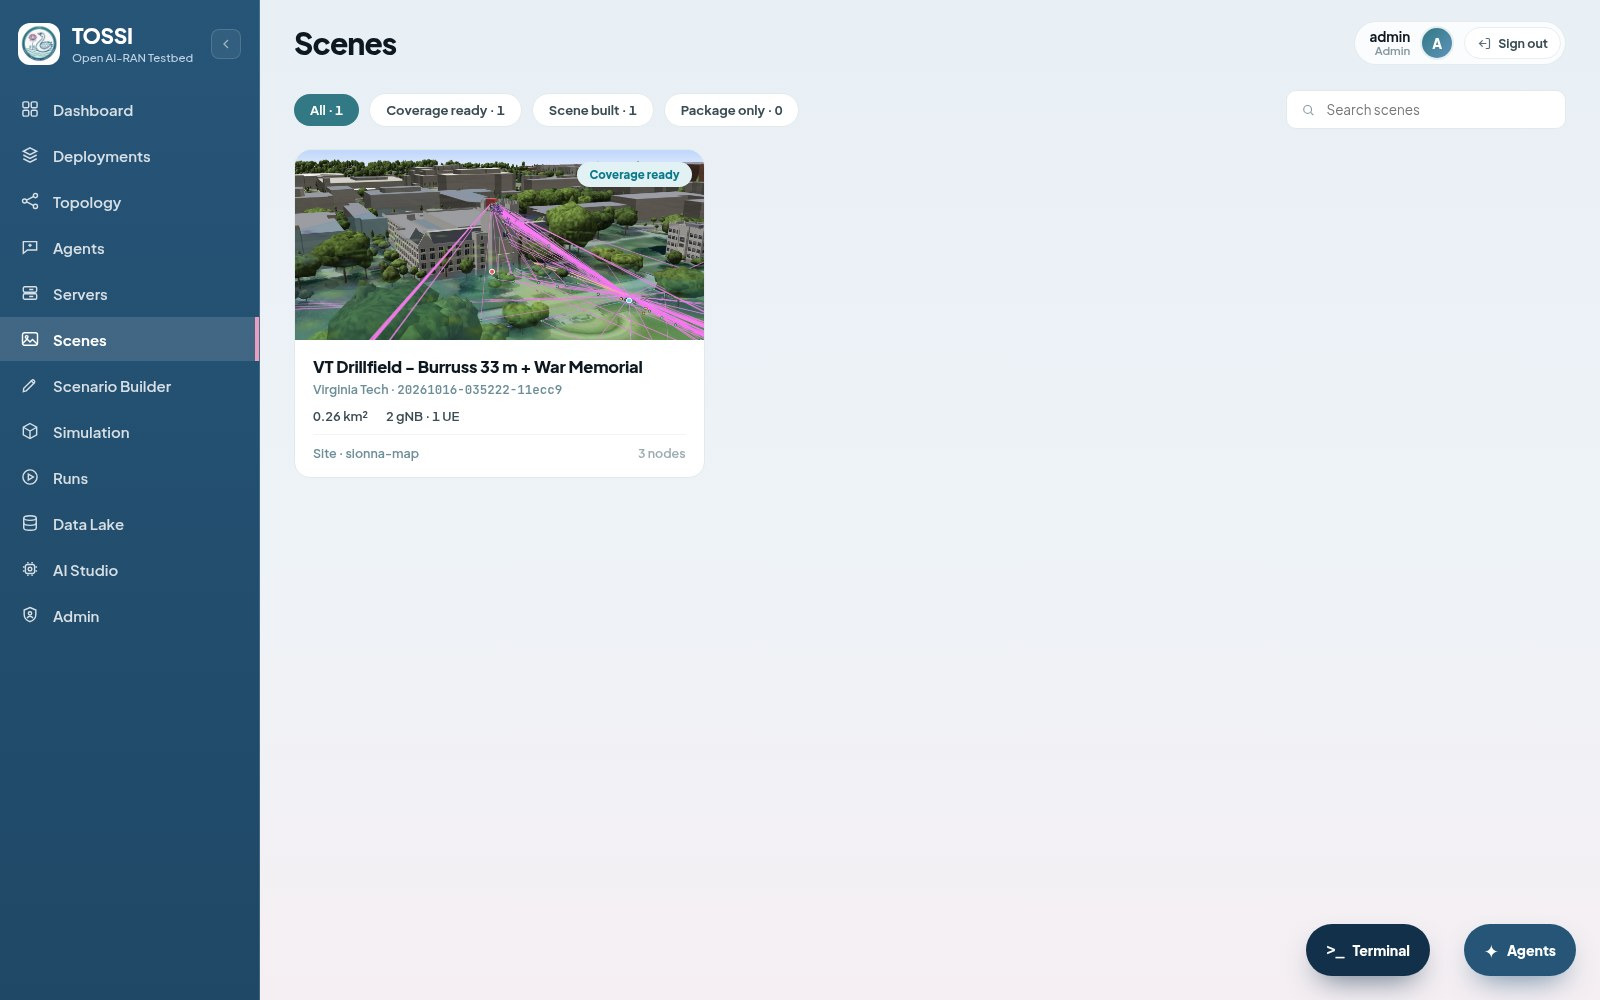
| Scenes | The library of scenes built in the Scenario Builder |
| Scenario Builder | Draw an area, place transmitters and receivers, build the scene, trace and compute coverage |
| Simulation | Run a RAN over a ray-traced channel, or a two-cell handover |
| Runs | History of stack deployments and simulation recordings |
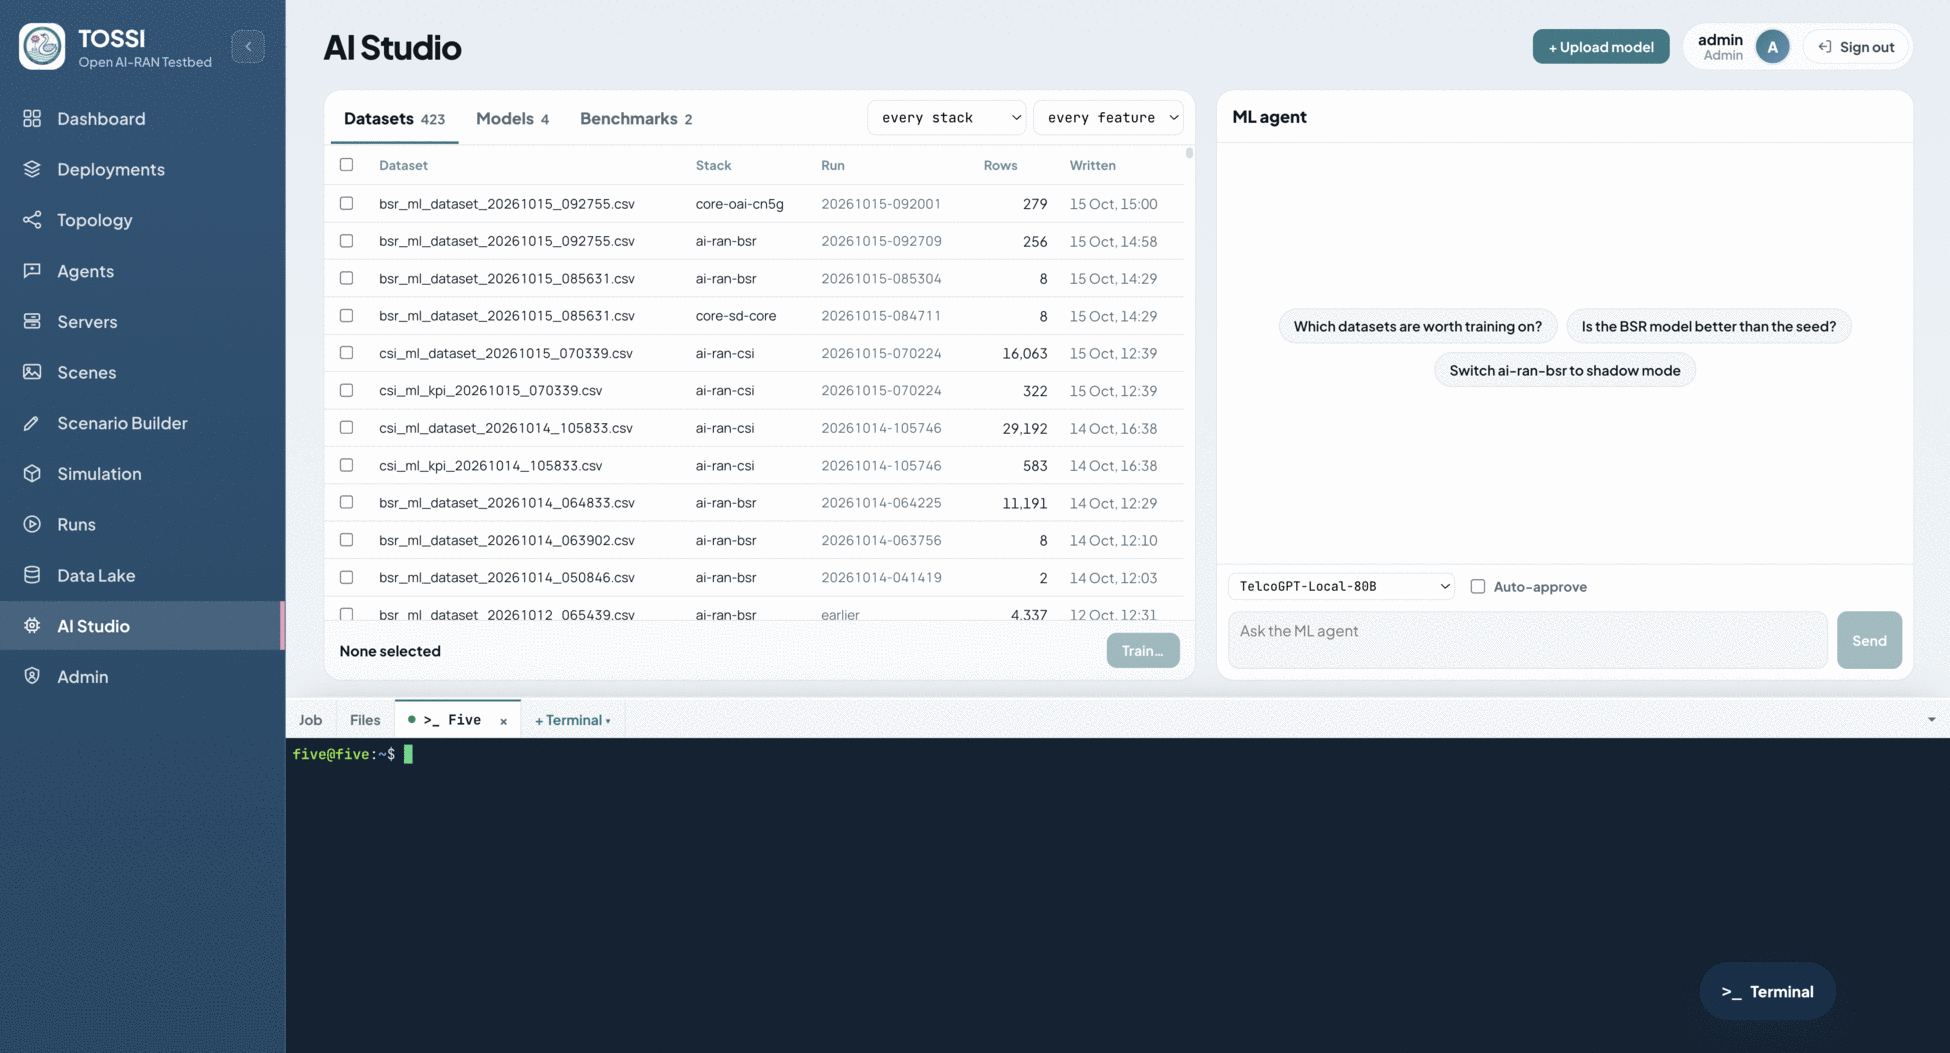
| Data Lake | Every run's logs and datasets, by stack, with selection for training |
| AI Studio | Datasets, models and benchmarks, with the ML agent alongside |
While a job runs, every page shows which stack and action are running, the progress, the current step, a timer and controls to view the log or cancel. A terminal and the agent chat are available from any page.
Running stacks
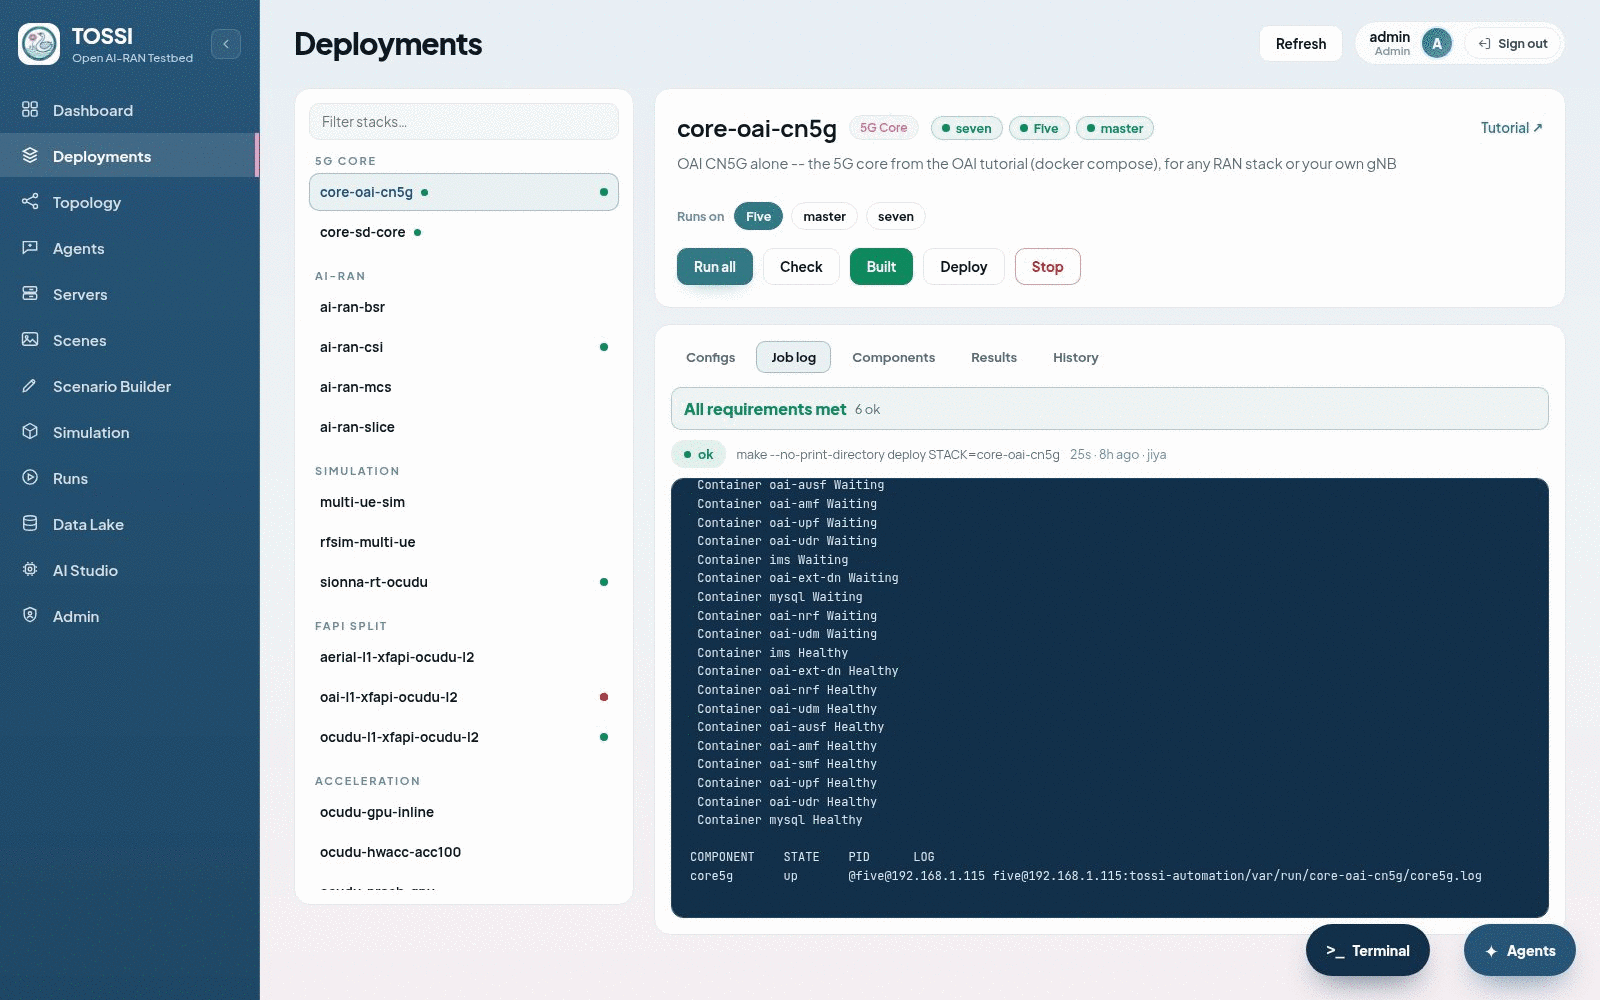
Stacks are deployed, configured and inspected from the Deployments page, or from the shell with the same targets.
Deploying a stack
Select the stack, then the server it should run on. Servers that cannot meet the stack's requirements are shown as unavailable with the reason. The actions are:
| Action | Runs | Notes |
|---|---|---|
| Check | make check | Verifies only the capabilities the stack declares |
| Build | make build | Changing a setting that affects compilation resets the built state |
| Deploy | make deploy | Starts components in order and waits for each health pattern |
| Run all | make all | Install, then build, then deploy |
| Train | make train | Only on stacks that define a training target |
| Stop | make stop | Stops this stack's components, never the core |
One job runs at a time. The exception is stopping a different stack, which is always permitted.
A first deployment follows a fixed order: deploy a core stack; run Check on the RAN stack and resolve anything it reports; review the configuration; run Run all and watch the job log; then confirm on the components view that each component reports as up.
The equivalent from a shell:
make list
make check  STACK=<stack>            # FIX=1 to remediate
make all    STACK=<stack>
make status
make stop   STACK=<stack>
DRYRUN=1 make all STACK=<stack>      # print the steps, run nothing
Placing one component on another server writes a host variable into the stack's settings file, which the dashboard and the command line both read:
echo 'HOST_<COMPONENT>=user@server' >> var/overrides/<stack>.env
make all STACK=<stack>
Configuring a stack
Per-stack settings are held in one overrides file shared with the command line. The configuration view exposes them as:
- Knobs declared by the stack itself, such as the radio front end, the ML mode or the gNB layout.
- Configuration files for the radio, CU, DU, UE, core and timing. These can be edited in place, with the previous version backed up, or copied to a stack-local path.
- 5G core selection and the parameters the RAN needs from it, taken from core defaults, from the operator's own files, or entered directly.
- Source selection between an upstream clone and a local tree, with an option to reuse an existing build.
- Servers, one choice per component.
Each deployment exposes its job log, the per-component state and log, any output datasets, and the history of past jobs with the settings each ran with.
Simulating
A scene is built once in the Scenario Builder, then used by either simulation mode.
Building a scene
Scenes are created in the Scenario Builder and listed in the scene library. The side panel works top to bottom through four groups:
| Group | What it sets |
|---|---|
| Design | The area, transmitters, receivers and a movement route. Building heights are editable and custom meshes can be imported |
| Build | The minimum footprint and ground model, and whether to include terrain, open building data and foliage |
| Configure | The propagation model and bounce count, the antenna pattern and array, the receivers and their movement, and the DU config the channel feeds |
| Solve and results | Ray tracing per cell, a coverage map, the per-link KPIs, a channel export, and optionally a reproducible scene bundle |
Build, trace and coverage run as jobs on a single worker, one at a time, so concurrent requests cannot exhaust GPU memory. Each has a time limit, and a job console reports progress and allows cancellation.
Running a RAN over a simulated channel
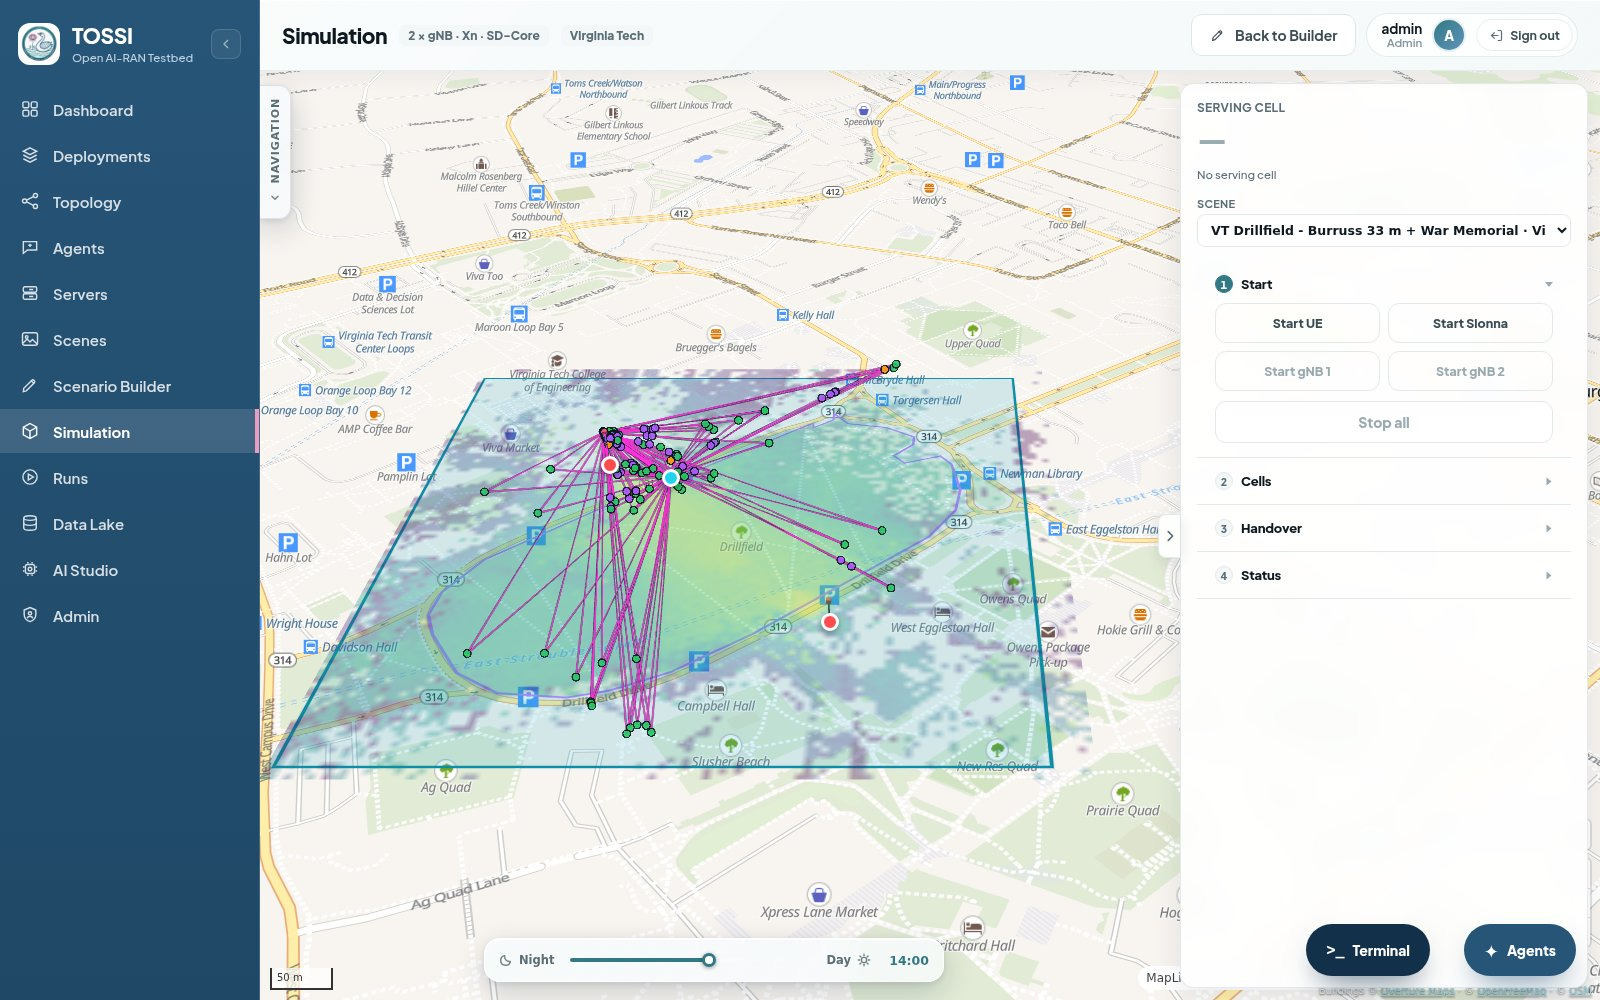
The simulation view runs a real CU, DU and UE with the channel between them computed live from a built scene. It does not start processes itself: it deploys the corresponding stack through the normal deployment path, passing the selected scene and DU configuration for that run.
The prerequisites are a built scene, a running core, the simulation stack deployed successfully at least once on the intended server, no other job in progress, and a DU configuration whose sample rate matches what the ray tracer publishes. A GPU is needed for real-time tracing.
Set the receiver movement before starting: when movement begins, whether the route runs one way or both, and how many laps. Progress is tracked through the core, CU, DU, tracer, channel, UE and attach stages, and the live readouts cover path gain, path count, trace time, Doppler and coherence from the tracer, and SINR, RSRP, SNR, CQI, MCS and block error counts from the radio.
When the stack runs on another server the platform mirrors that server's logs, ray geometry and process state, so the live views behave as though the run were local. Every simulation is recorded from the moment it starts.
Handover simulation
The handover view runs two cells connected over Xn, each with its own channel, and a receiver that walks between them. It requires a scene with two transmitters and a route, and a running core.
Start the receiver, then both cells, then the channel publisher, which streams one channel per cell. Confirm that both cells report core connectivity, the Xn link and which is serving. A handover can then be forced, or left to occur on its own as the receiver walks, since measurement-triggered handover is enabled in both cell configurations. The outcome is reported as completed, failed, in progress or unknown.
Recorded runs can be compared against an A3 event model through the API, which returns the predicted events, the actual events parsed from the CU log, and a comparison including ping-pongs.
Data and models
Every run is recorded. Its datasets feed training, and a trained model returns to the DU through the lifecycle above.
Reviewing runs and datasets
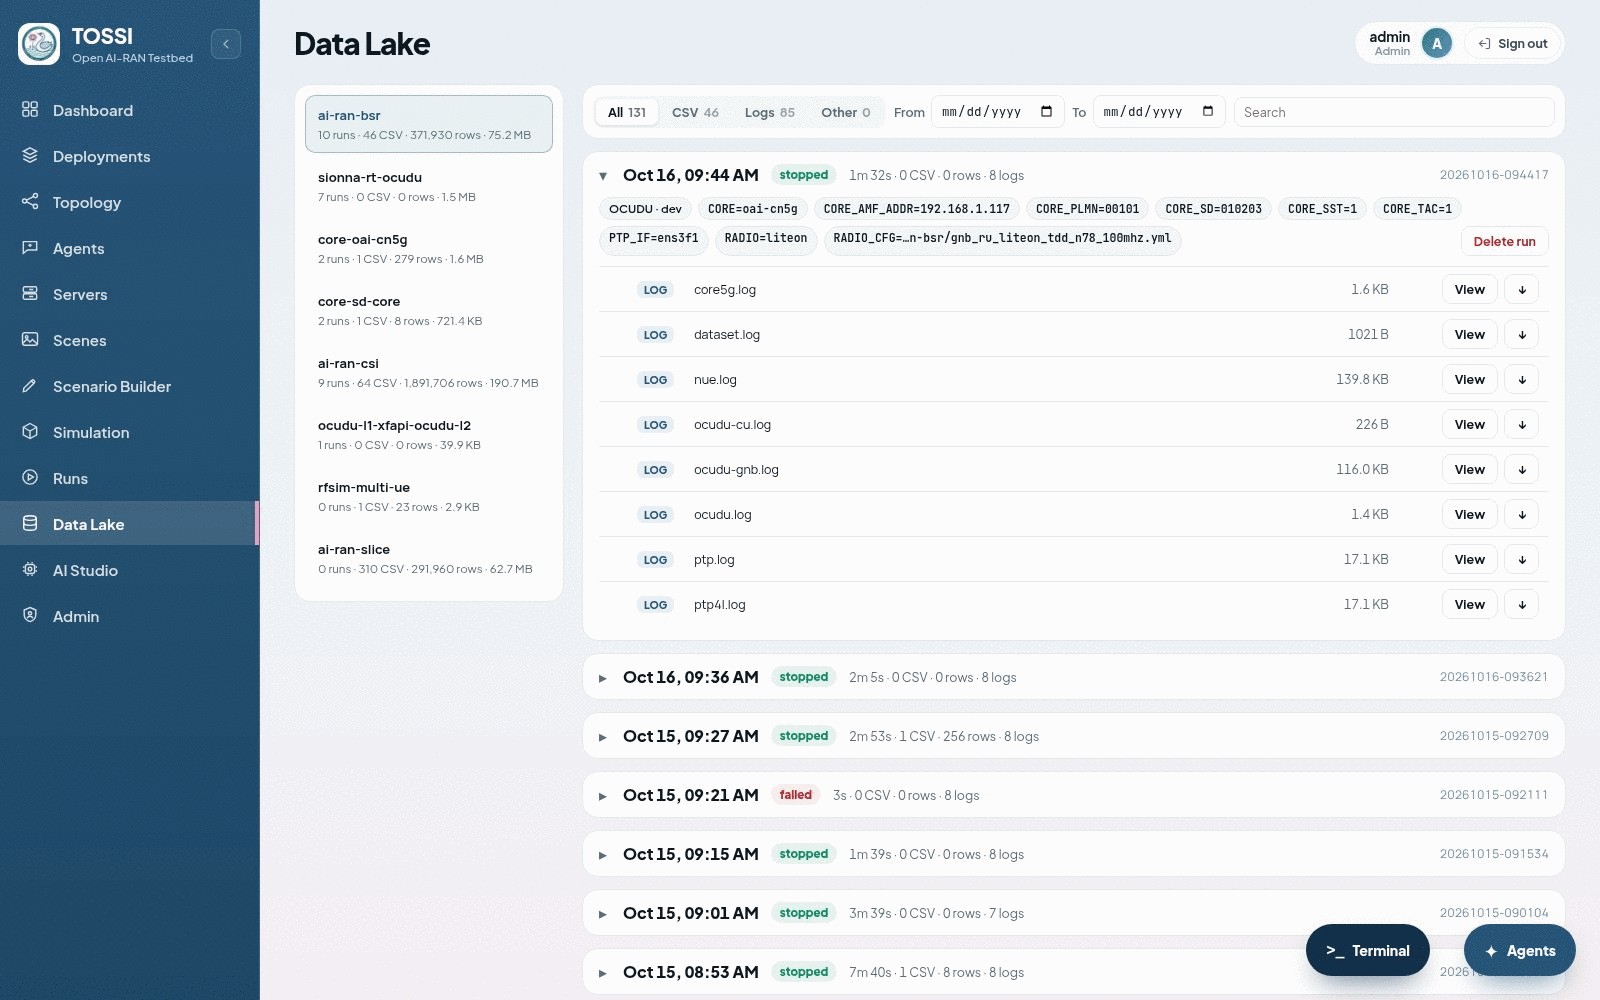
Stack deployments and simulation recordings are listed together, filterable by type and stack, with their duration, outcome, servers and the data and logs each produced. A stack run opens when it is deployed and closes when it is stopped, at which point the datasets written during the run and the tail of each log are copied into the run record.
The data lake presents one entry per stack with its runs, files, row counts and total size. Each run records its outcome, duration, source branch, host and every setting it ran with, and each file can be previewed or downloaded. Datasets are matched to features by file name, and a selection can be carried directly into training.
Training a model
Training follows the lifecycle described above.
- Collect. Set the stack's ML mode to
collectand deploy it with a receiver attached and traffic flowing. Repeat across several runs with varied conditions. Stop the stack so the run closes and its datasets are registered. - Train. Filter to the stack, select the datasets, and start training. All selected files must come from one stack. Training is requested through the ML agent, which calls the training action with exactly those files and records a benchmark against the baseline.
- Shadow. Set the mode to
shadowand redeploy, then compare the model against the baseline in the DU log. - Closed loop. Only once the model beats the baseline, set the mode to
closed-loop.
There is no separate promotion step. Promotion means changing the mode and redeploying, and each stage requires an explicit approval. Training is placed automatically on the best available GPU server, with the model file copied back on completion.
The equivalent from a shell:
make train STACK=<stack>                              # every dataset in the source tree
TRAIN_SET=/path/to/list.txt make train STACK=<stack>  # one dataset path per line
DRYRUN=1 make train STACK=<stack>                     # show the steps only
An externally trained model can be uploaded and brought into service, provided it matches the format the predictor expects. It is copied to the path the DU loads, with the previous model backed up, and the DU picks it up without a restart.
Further reading
The four AI-RAN features have their own pages, each covering the model, its inputs and the results measured on the testbed:
- ML-Based UL MCS
- ML-Based BSR Periodicity
- Predictive CSI for Link Adaptation
- Slice-ML: Hierarchical RAN Slicing
The digital twin is covered in more depth under SIONNA RT with OCUDU RAN.
Source, automation engine and stack catalogue: TOSSI-Foundation/Open-AIRAN-Testbed, branch main.